The Brand Performance Reports are a suite of four reports within the AI SEO Toolkit designed to show you how AI platforms perceive and position your brand against competitors.
These reports analyze your Share of Voice, brand sentiment, and narrative drivers to provide AI-generated strategic recommendations.
The four reports in this section are:
How Can Brand Performance Reports Help Me?
This suite of reports helps you understand and improve your brand's standing in the AI landscape. Use it to:
- Understand how AI platforms like ChatGPT, SearchGPT, Google AI Mode, Perplexity and Gemini perceive your brand
- Track your Share of Voice in AI-generated answers compared to your key competitors
- Analyze the sentiment (favorable vs. general) associated with your brand in AI conversations
- Discover the key narrative drivers—like brand visibility and trusted sources—that shape your reputation in AI
- Identify the key questions your audience is asking AI to find new content and messaging opportunities
- Receive AI-generated strategic recommendations to strengthen your brand positioning
How to Use the Brand Performance Reports
How to Access the Report
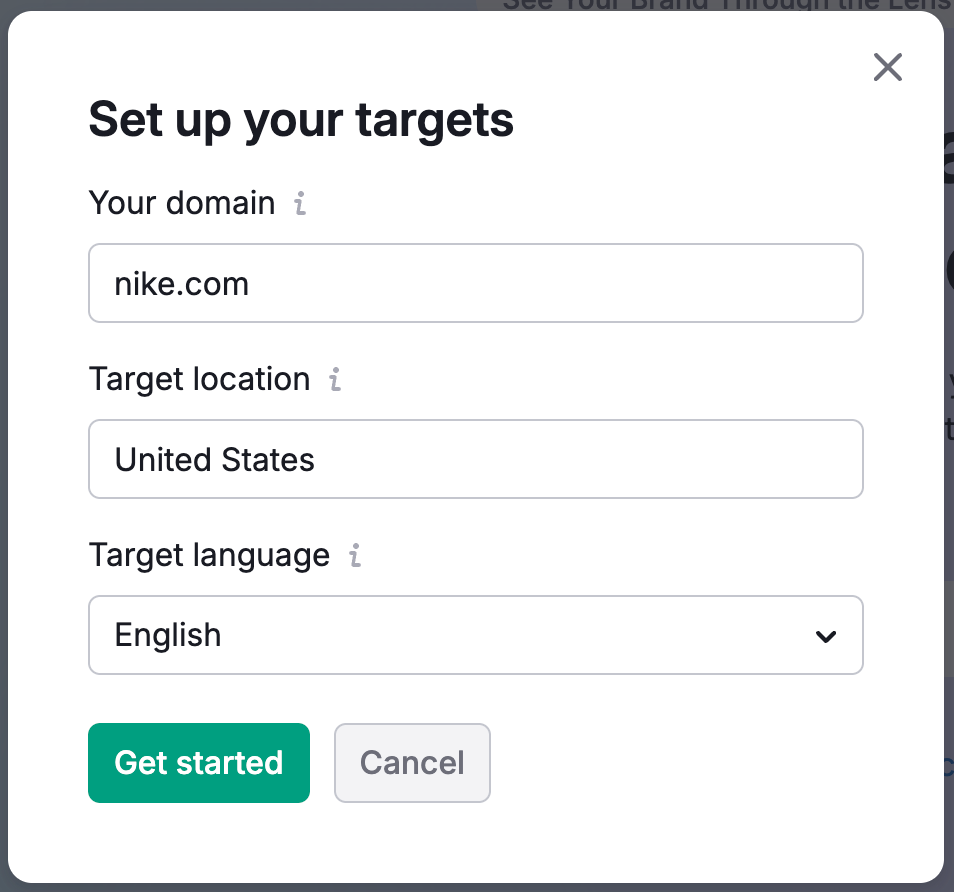
- Go to AI SEO Toolkit → Brand Performance section → Report.
- Enter your domain, select a target location (country, region, or city), and choose a target language.
Filters and Settings
To begin, navigate to the Brand Performance section in the AI SEO Toolkit. At the top of each report, you can set the parameters for your analysis:
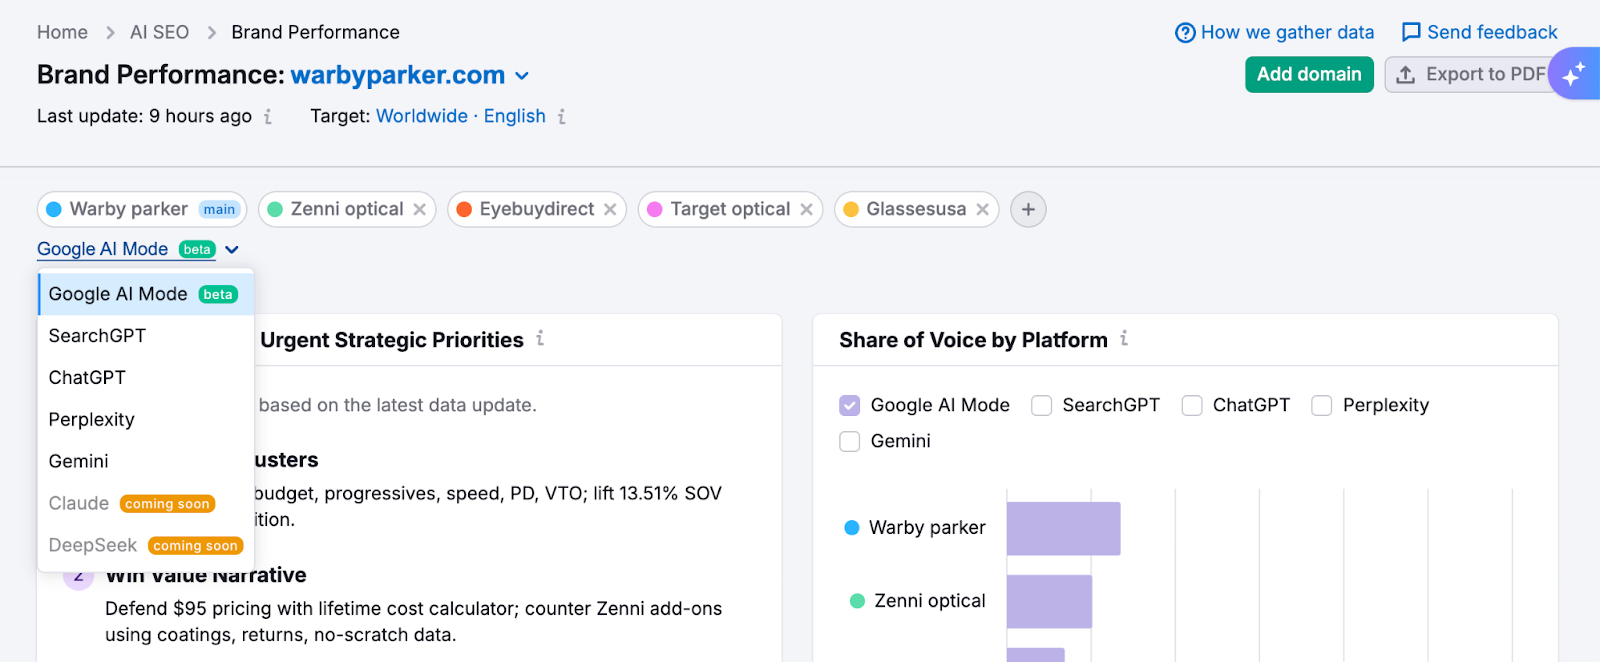
- Competitors: You can select up to nine competitors to compare against. The charts will update instantly to reflect your selection.
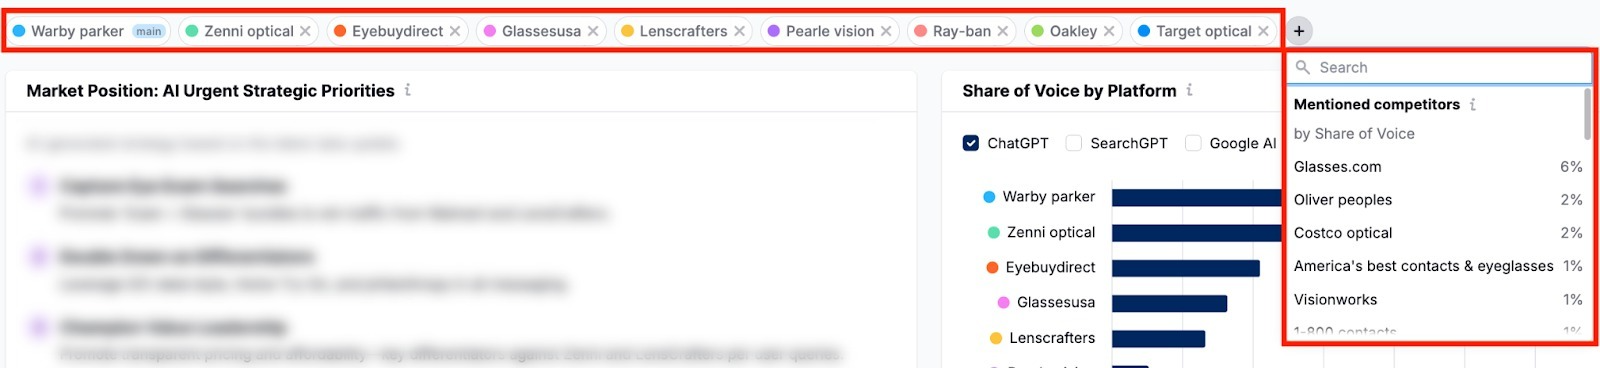
- AI Platform: Choose the specific AI platform you want to analyze from the filter located under the competitor selection. Currently the following LLMs are available: Google AI Mode, ChatGPT, SearchGPT, Perplexity, and Gemini.
Each report is structured to give you AI-generated strategic priorities, called “Insights,” at the top, followed by a deep dive into the data, and concludes with actionable "AI Strategic Opportunities" recommendations at the end.
These opportunities highlight specific actions you can take to strengthen your competitive position.
Step 1: Get a High-Level Overview
The Brand Performance Report is your main dashboard, providing a high-level summary of your brand's position in the AI landscape.
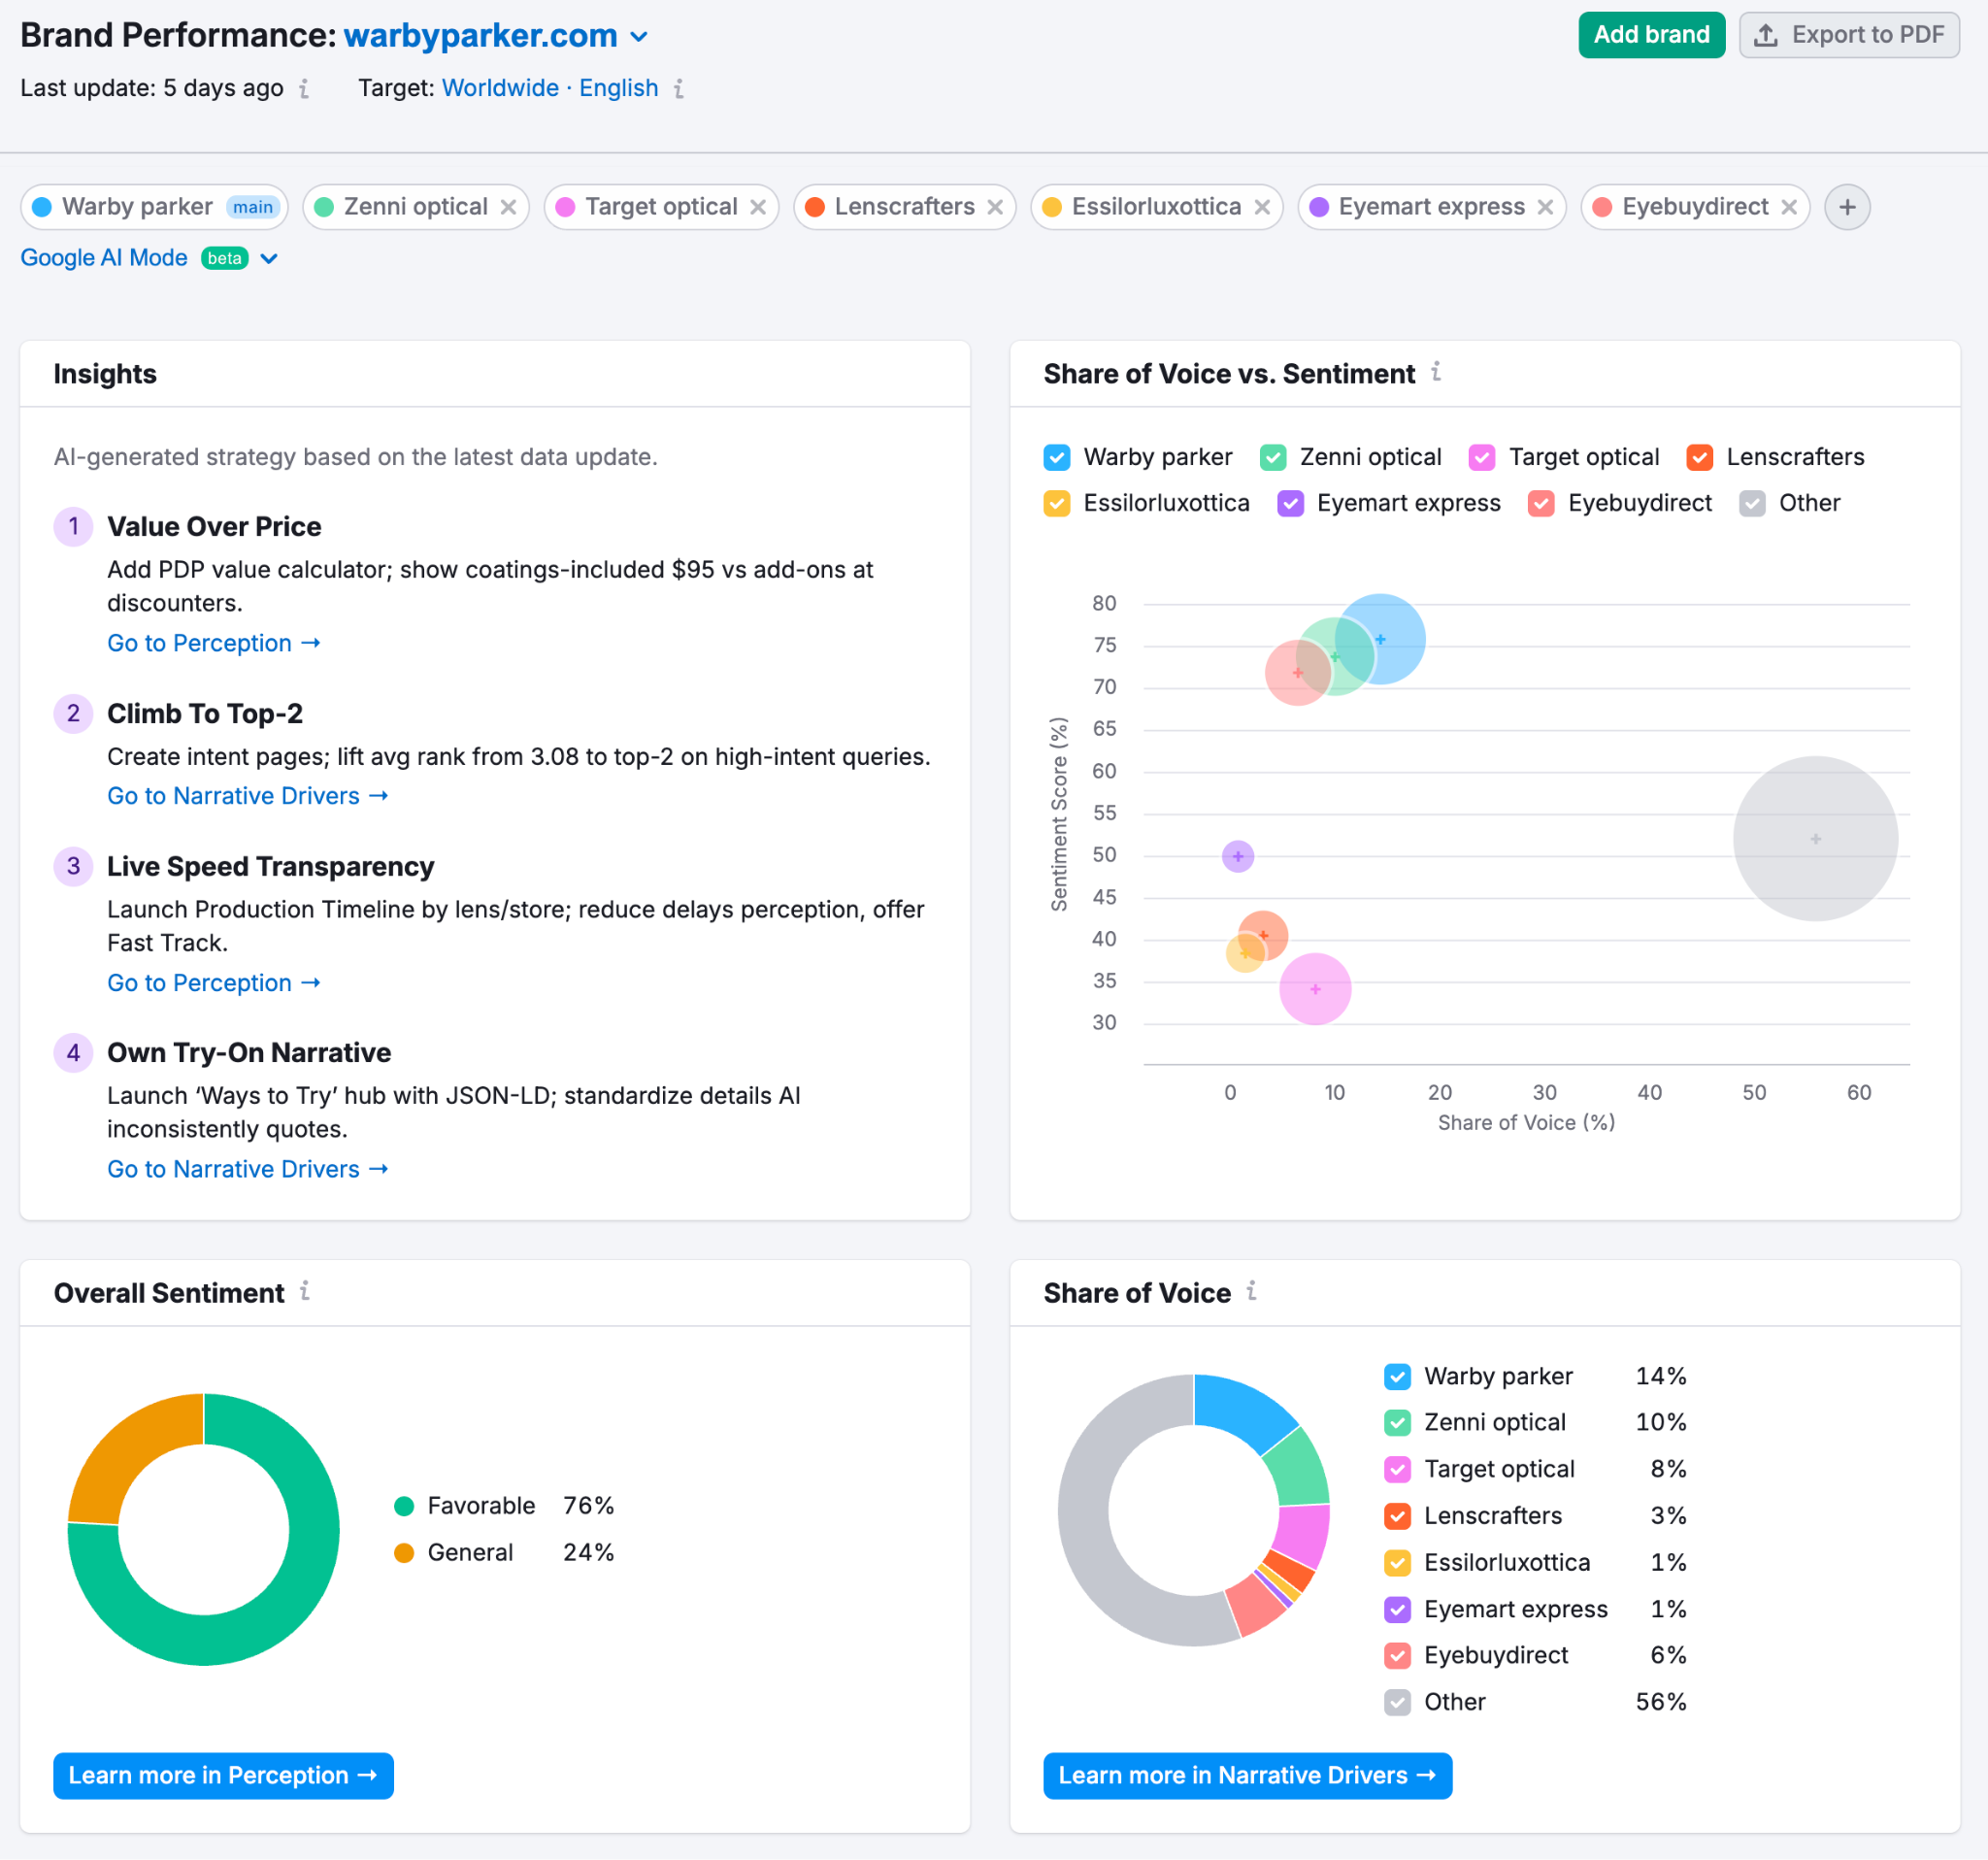
The key widgets include:
- Share of Voice vs. Sentiment: Helps you see if a higher volume of mentions also translates to a better perception score. Each competitor is a bubble on the chart, positioned based on their Share of Voice (horizontal axis) and Sentiment Score (vertical axis). This allows you to quickly assess the competitive landscape, identifying brands with high visibility but poor sentiment, or those with positive sentiment that represent a growth opportunity.
- Overall Sentiment: Checks the percentage of favorable and neutral mentions for your brand, giving you a clear, at-a-glance view of your brand's perception.
- Share of Voice: Compares your brand's overall visibility in AI answers against competitors, visualizing the market share of mentions for each brand.
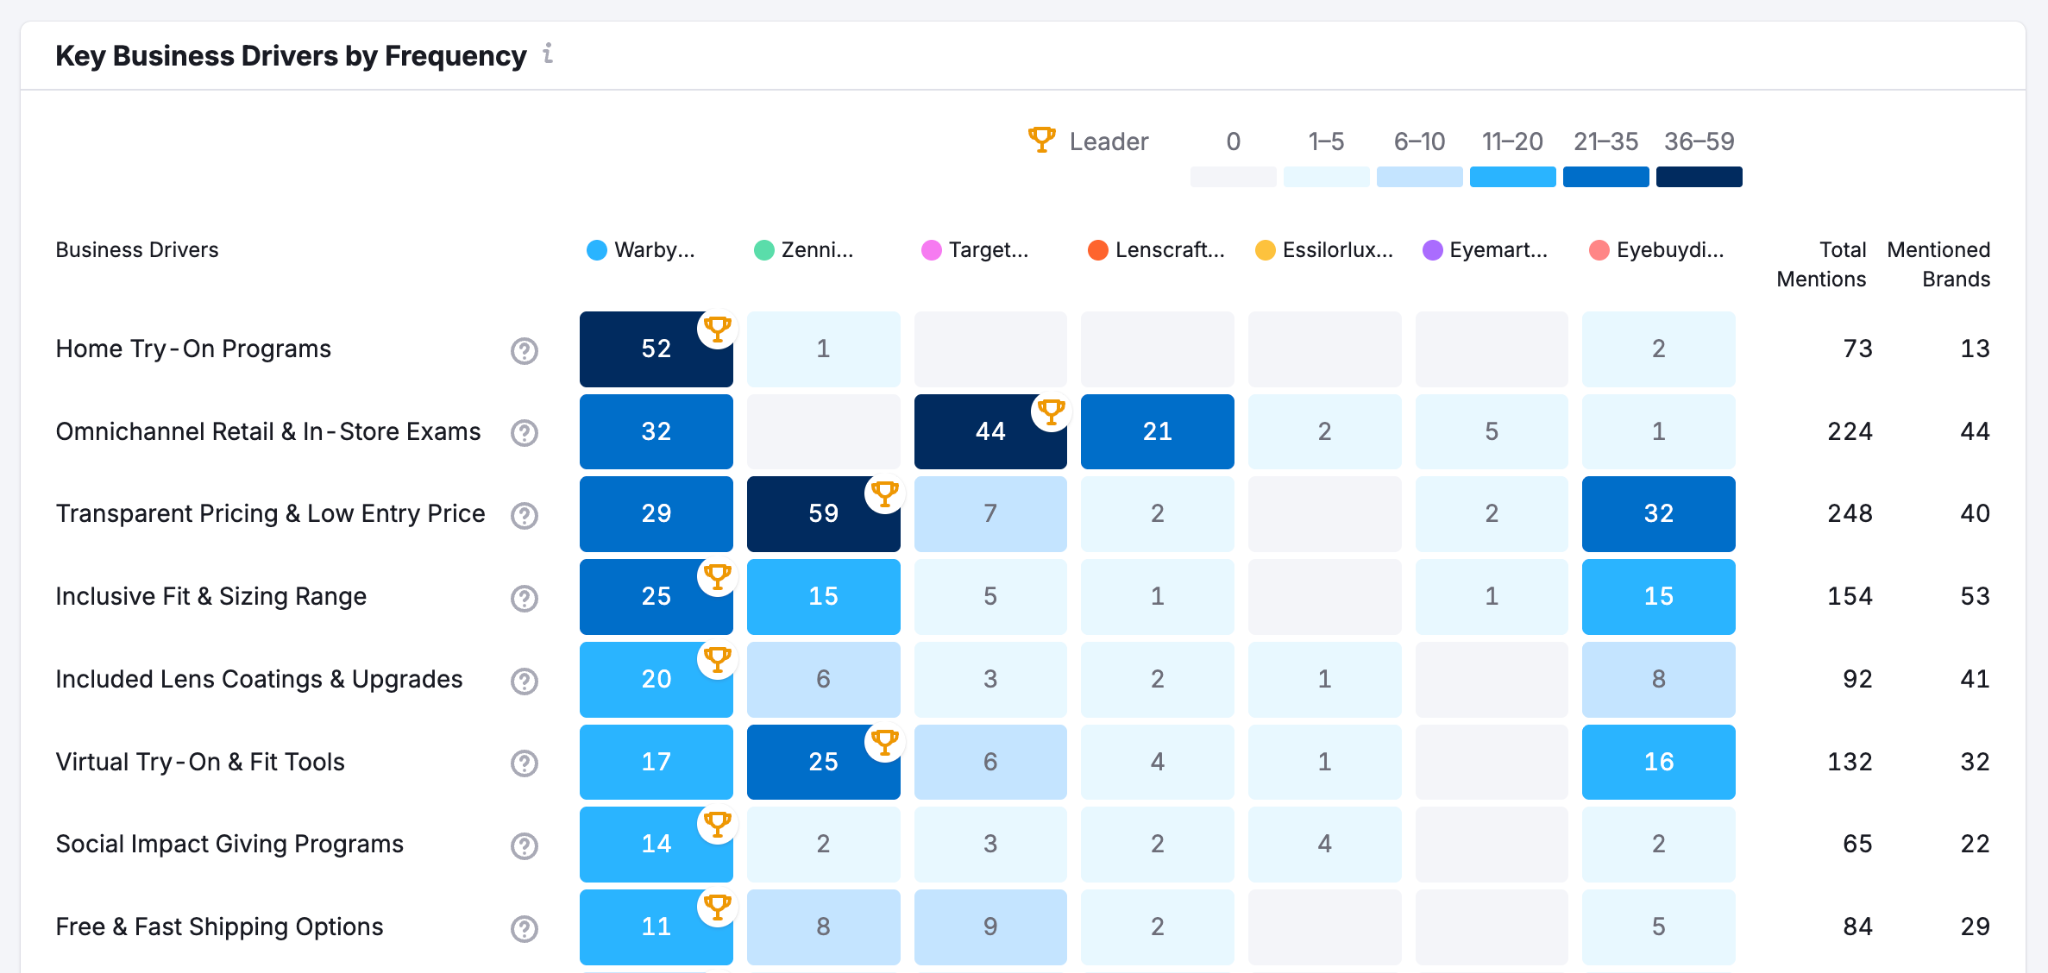
- Key Business Drivers by Frequency: This heatmap shows you which business-critical topics (like 'Fulfillment Speed' or 'Product Assortment') are mentioned most frequently for your brand versus your competitors. Use it to quickly identify your brand's strengths, weaknesses, and the topics where competitors are leading the conversation. A trophy icon highlights the leader for each driver.
- Competitor Comparison Cards: These cards provide a direct, side-by-side comparison of your brand against a specific competitor.
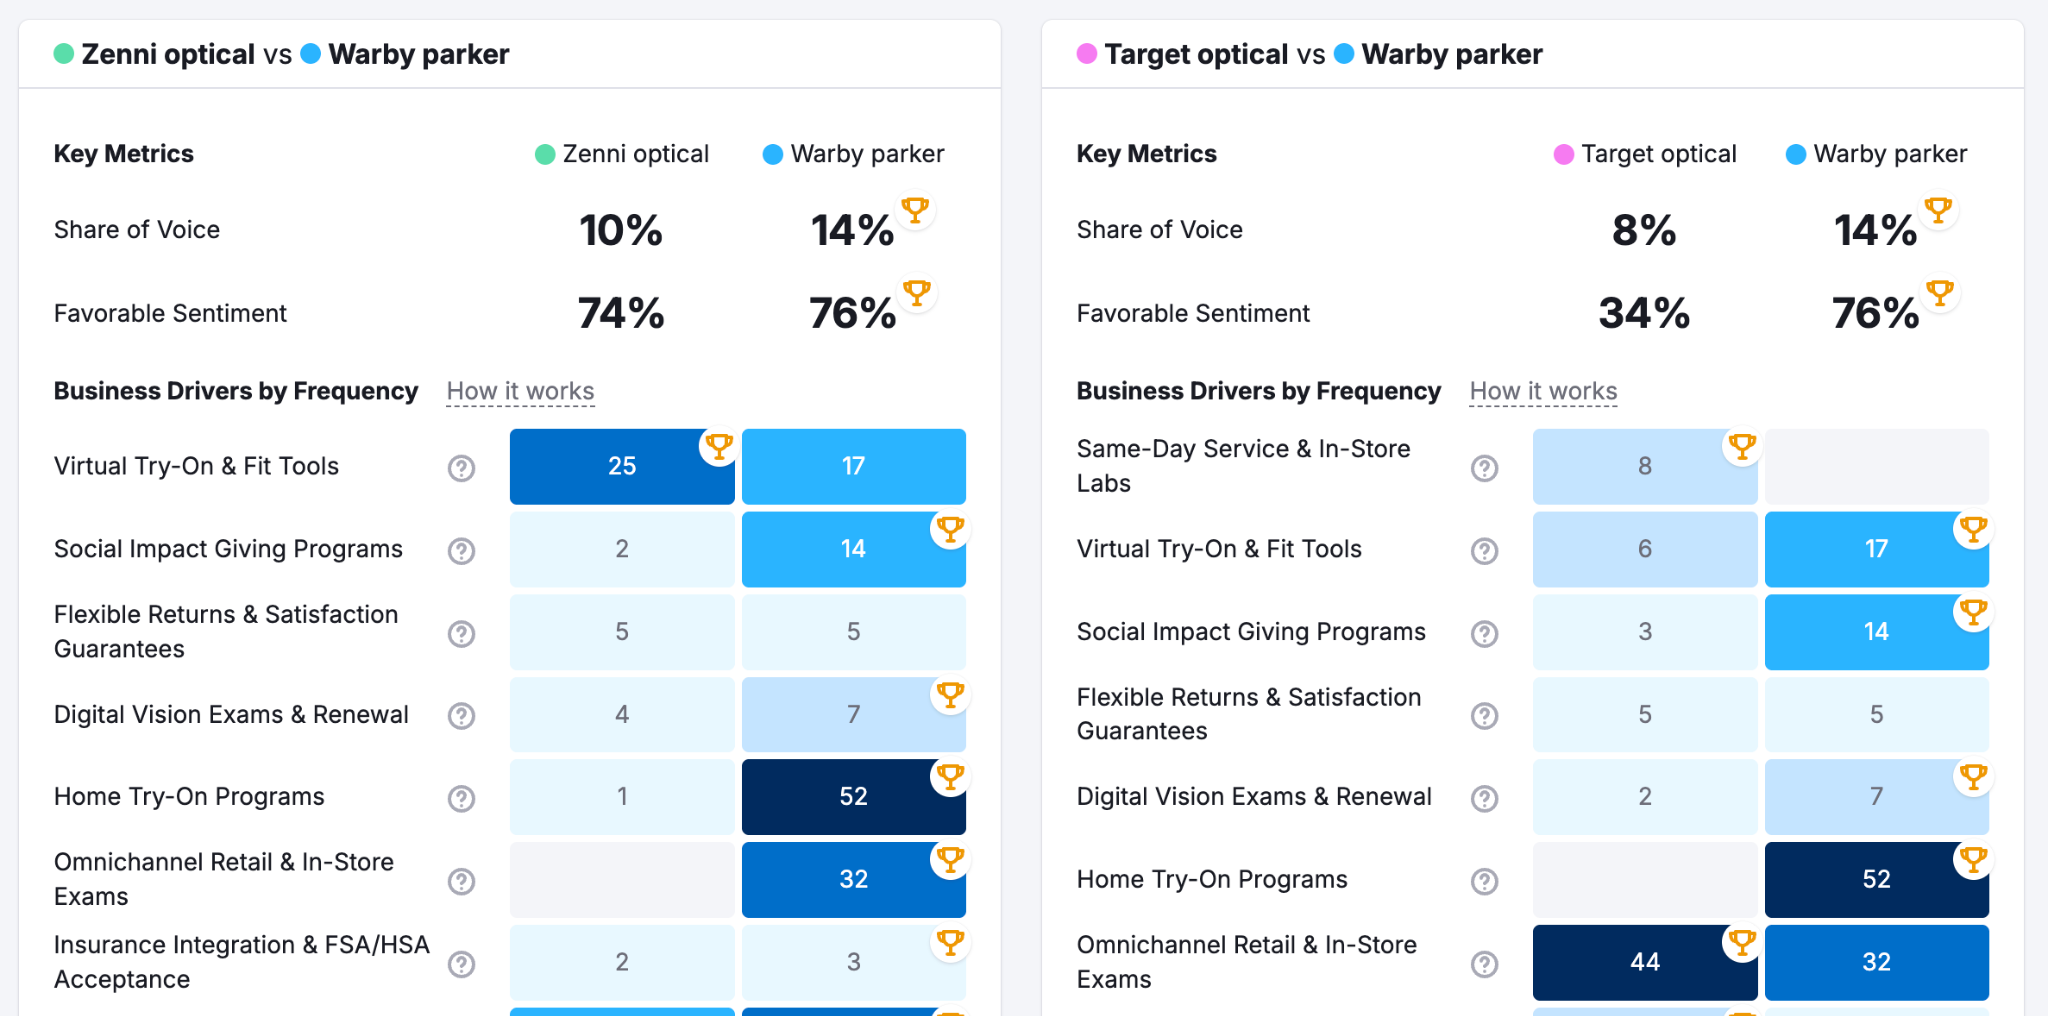
Each card includes:- Key Metrics: A head-to-head comparison of your Share of Voice and Favorable Sentiment percentages.
- Business Drivers by Frequency: A detailed breakdown comparing the frequency of mentions for specific business topics.
Step 2: Analyze Your Brand's Perception
The Perception Report provides a detailed analysis of sentiment to understand how your brand is perceived by AI platforms.
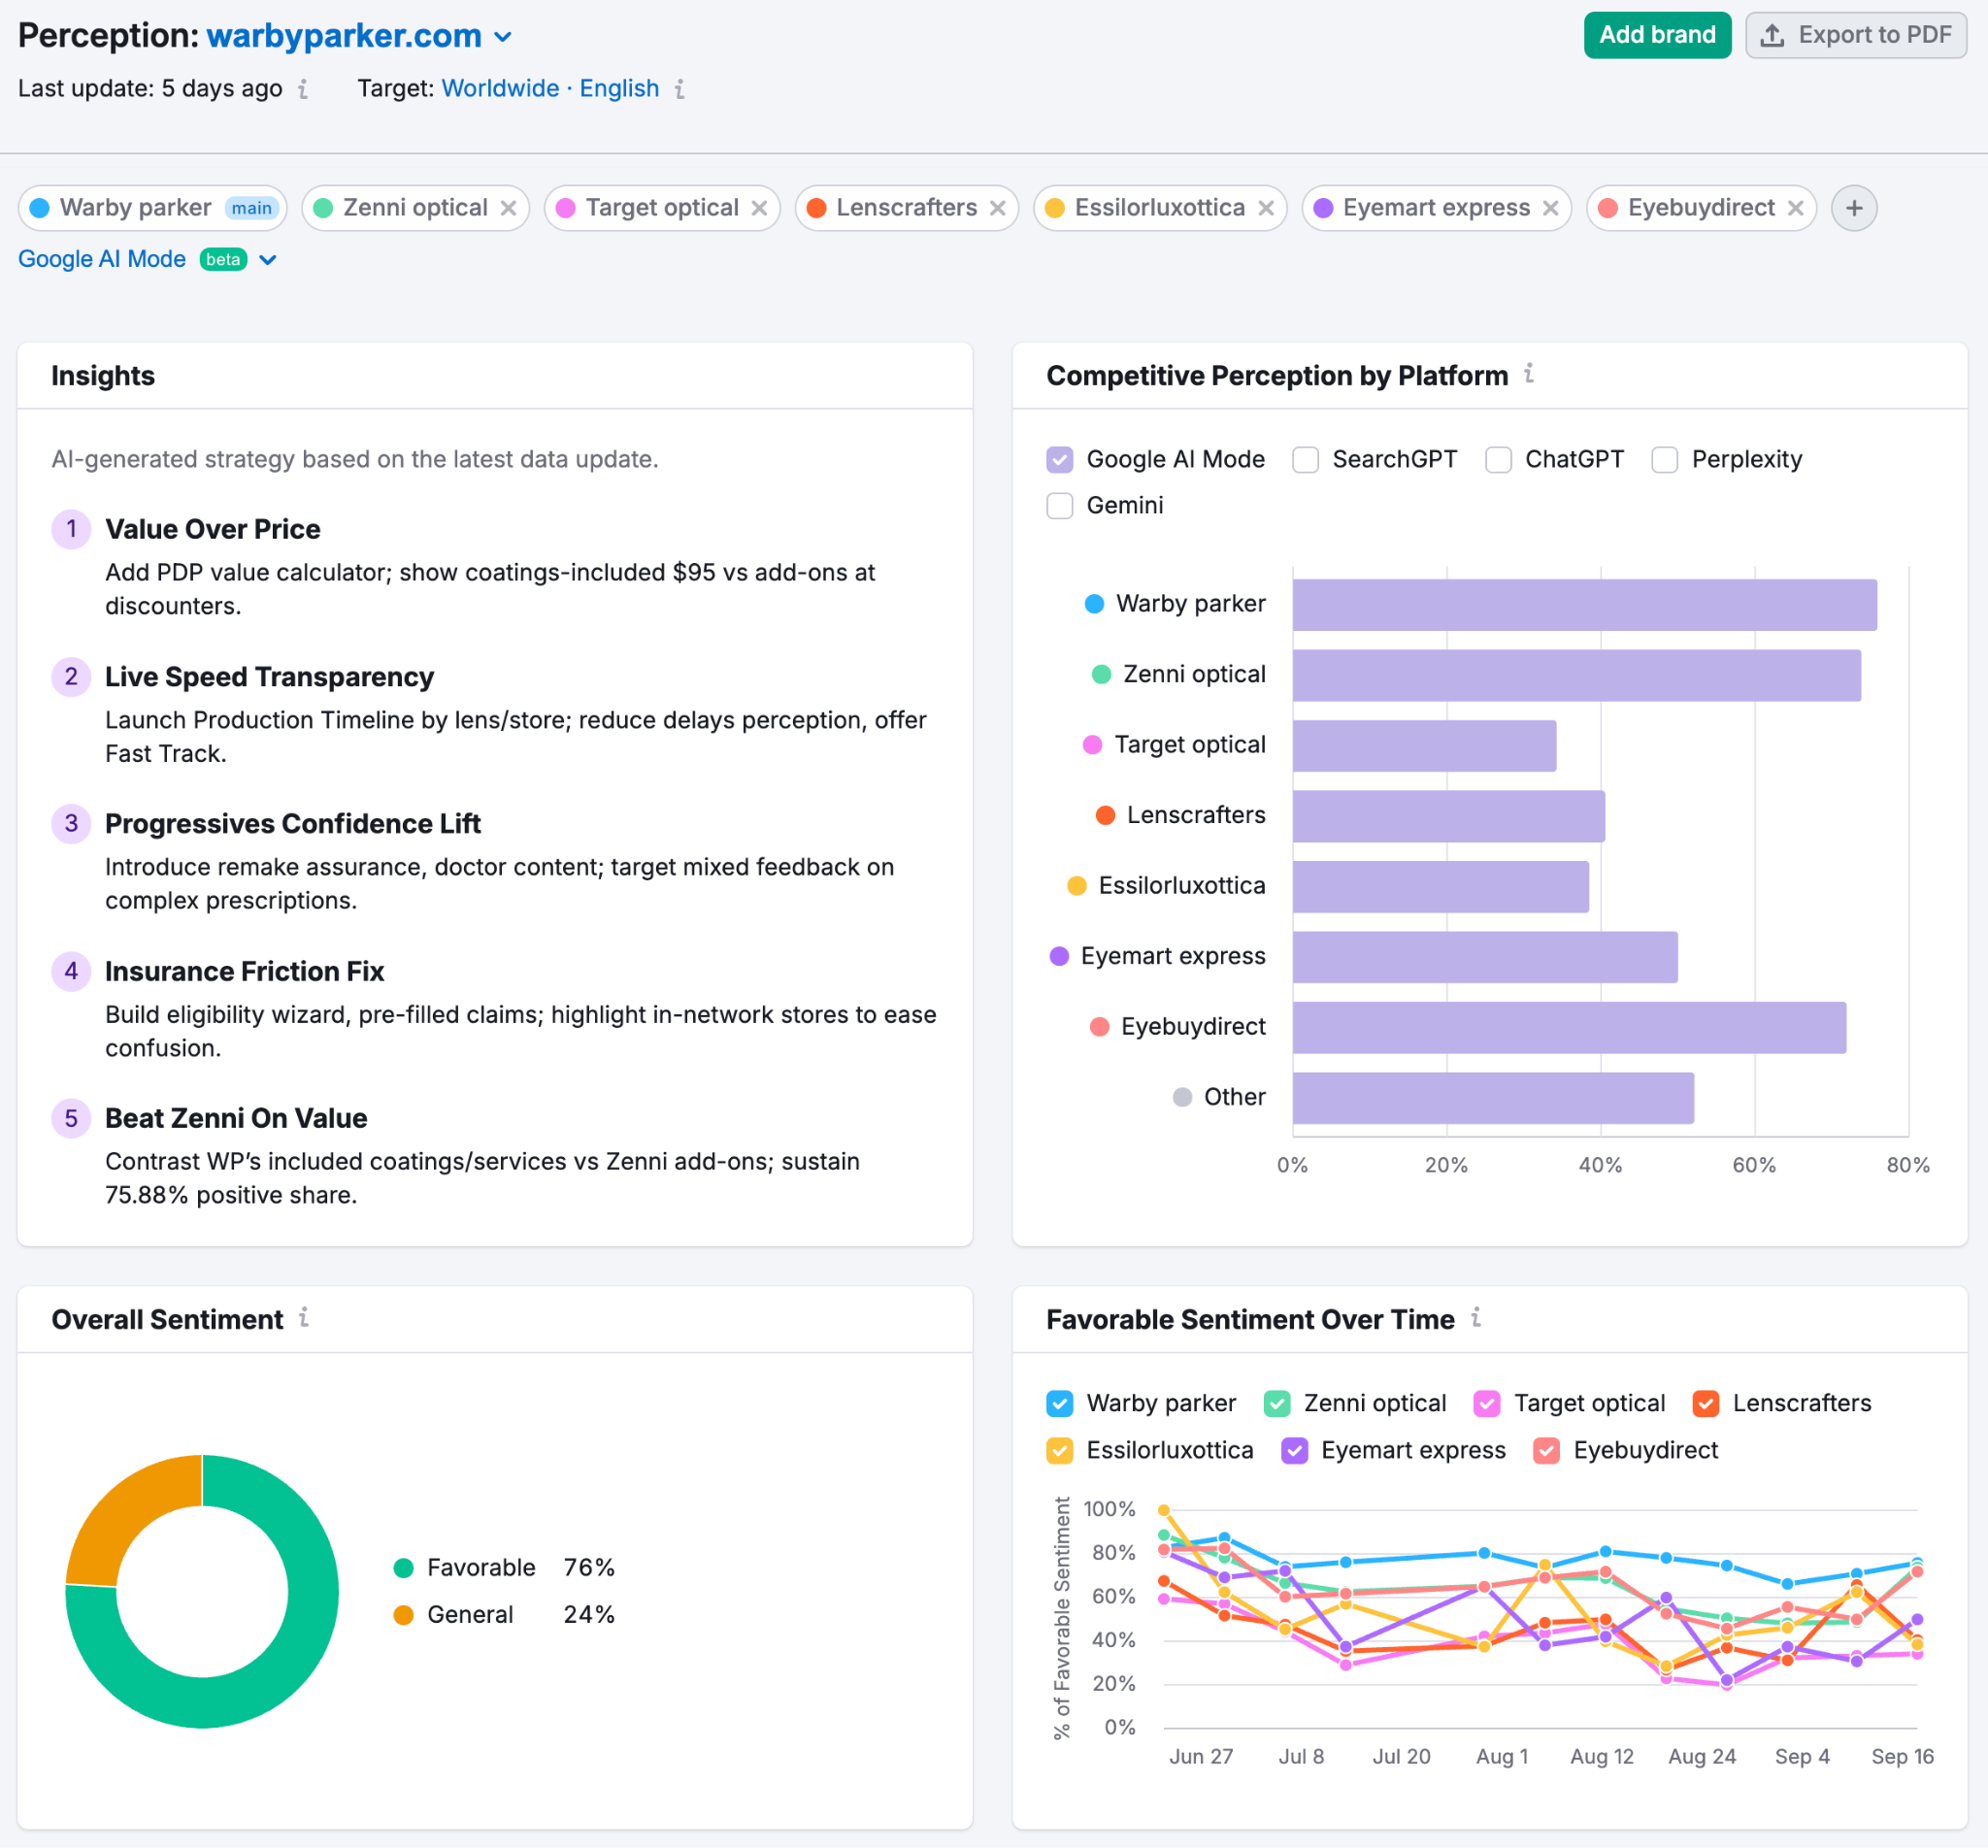
- Competitive Perception by Platform: Compares how different AI platforms perceive you versus your competitors, focusing on the share of positive sentiment. For each brand, you can see the percentage of favorable sentiment across platforms like ChatGPT, Gemini, and Perplexity, helping you identify which platforms have the most positive perception of your brand.
- Overall Sentiment: Checks the percentage of favorable versus neutral mentions.
- Favorable Sentiment over time: This graph tracks the percentage of favorable sentiment for your brand and your competitors over a period of time. Use it to monitor trends and see how your positive perception changes in comparison to others.
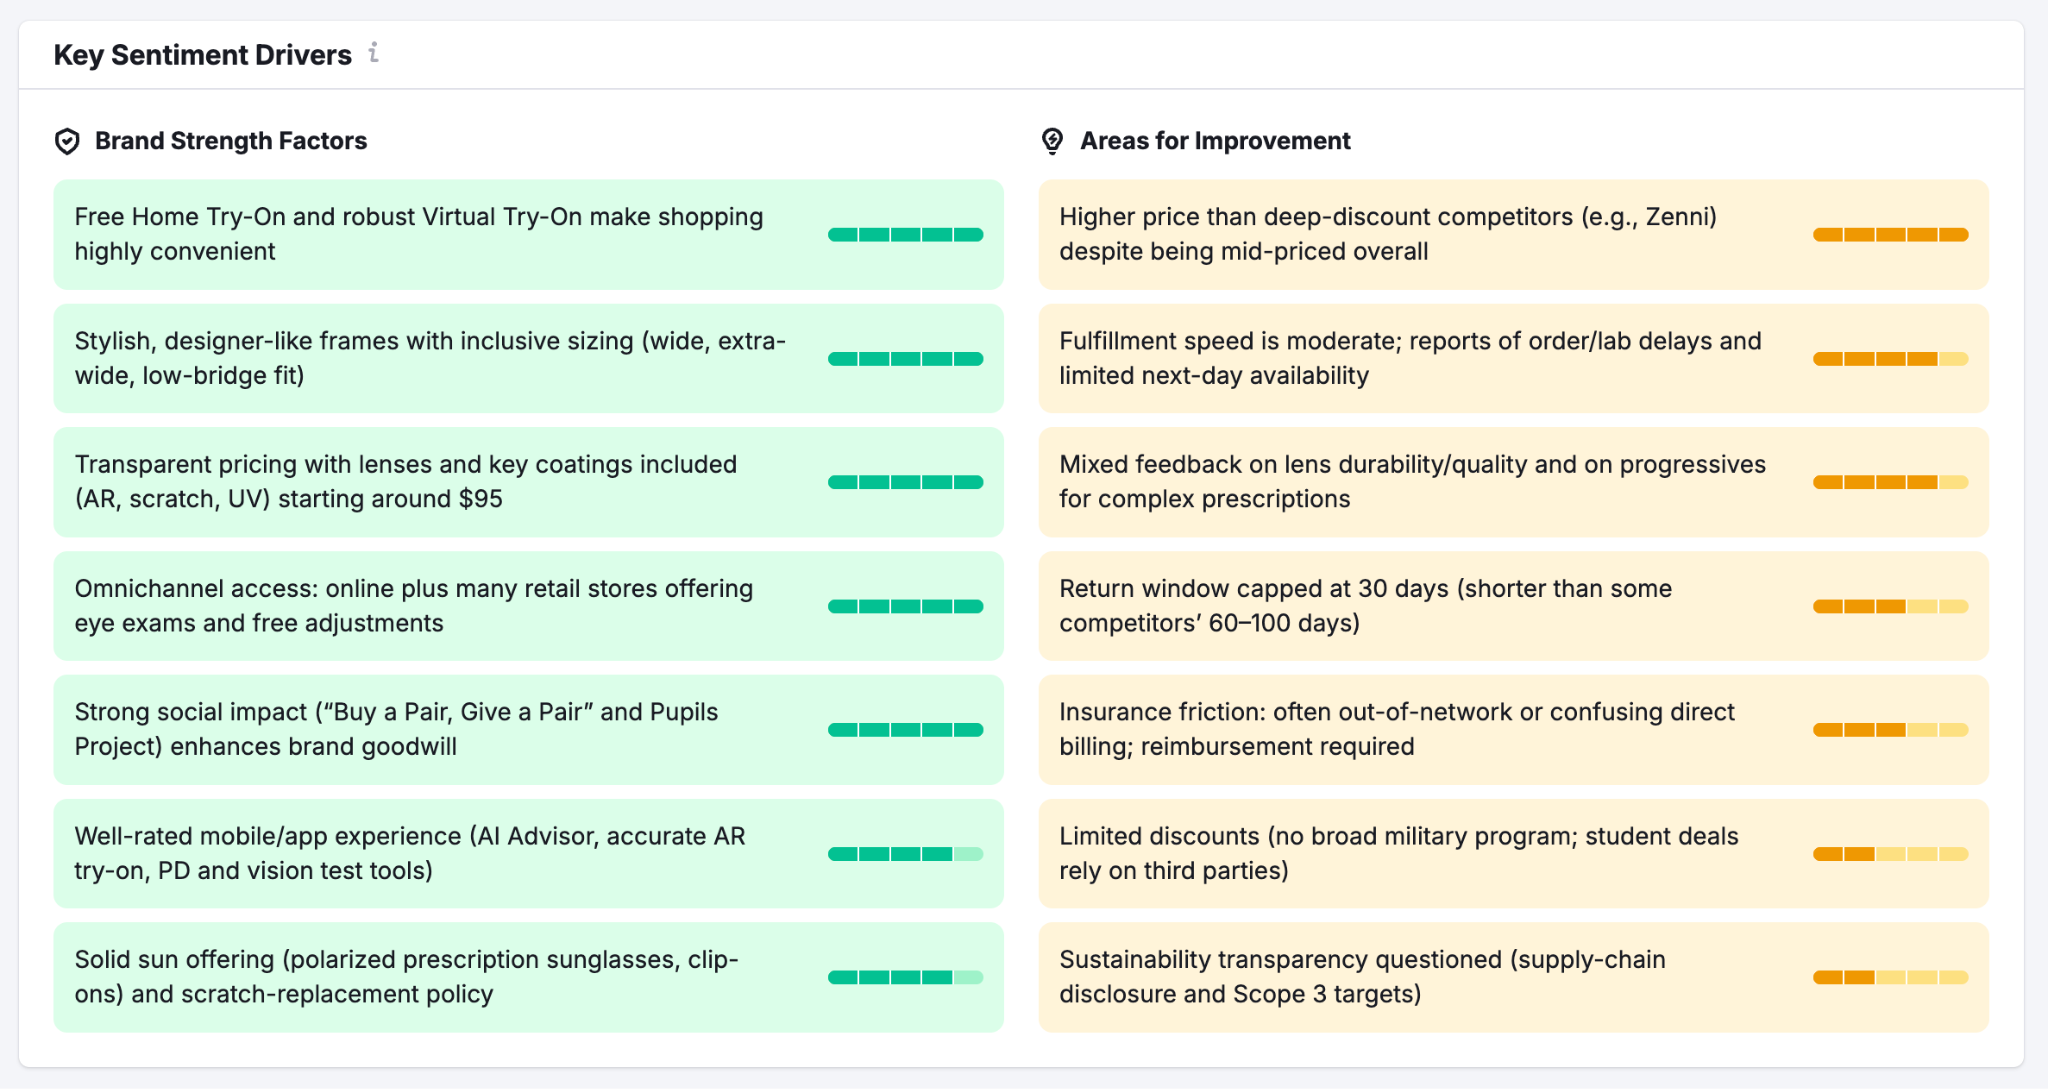
- Key Sentiment Drivers: Identifies what customers consistently praise (Brand Strength Factors) and their recurring pain points (Areas for Improvement).
Step 3: Discover What Drives Your Narrative
The Narrative Drivers Report combines data on visibility and citations to show you how your brand is represented in AI responses and which sources AI platforms trust. It helps you understand the story being told about your brand.
Key widgets include:
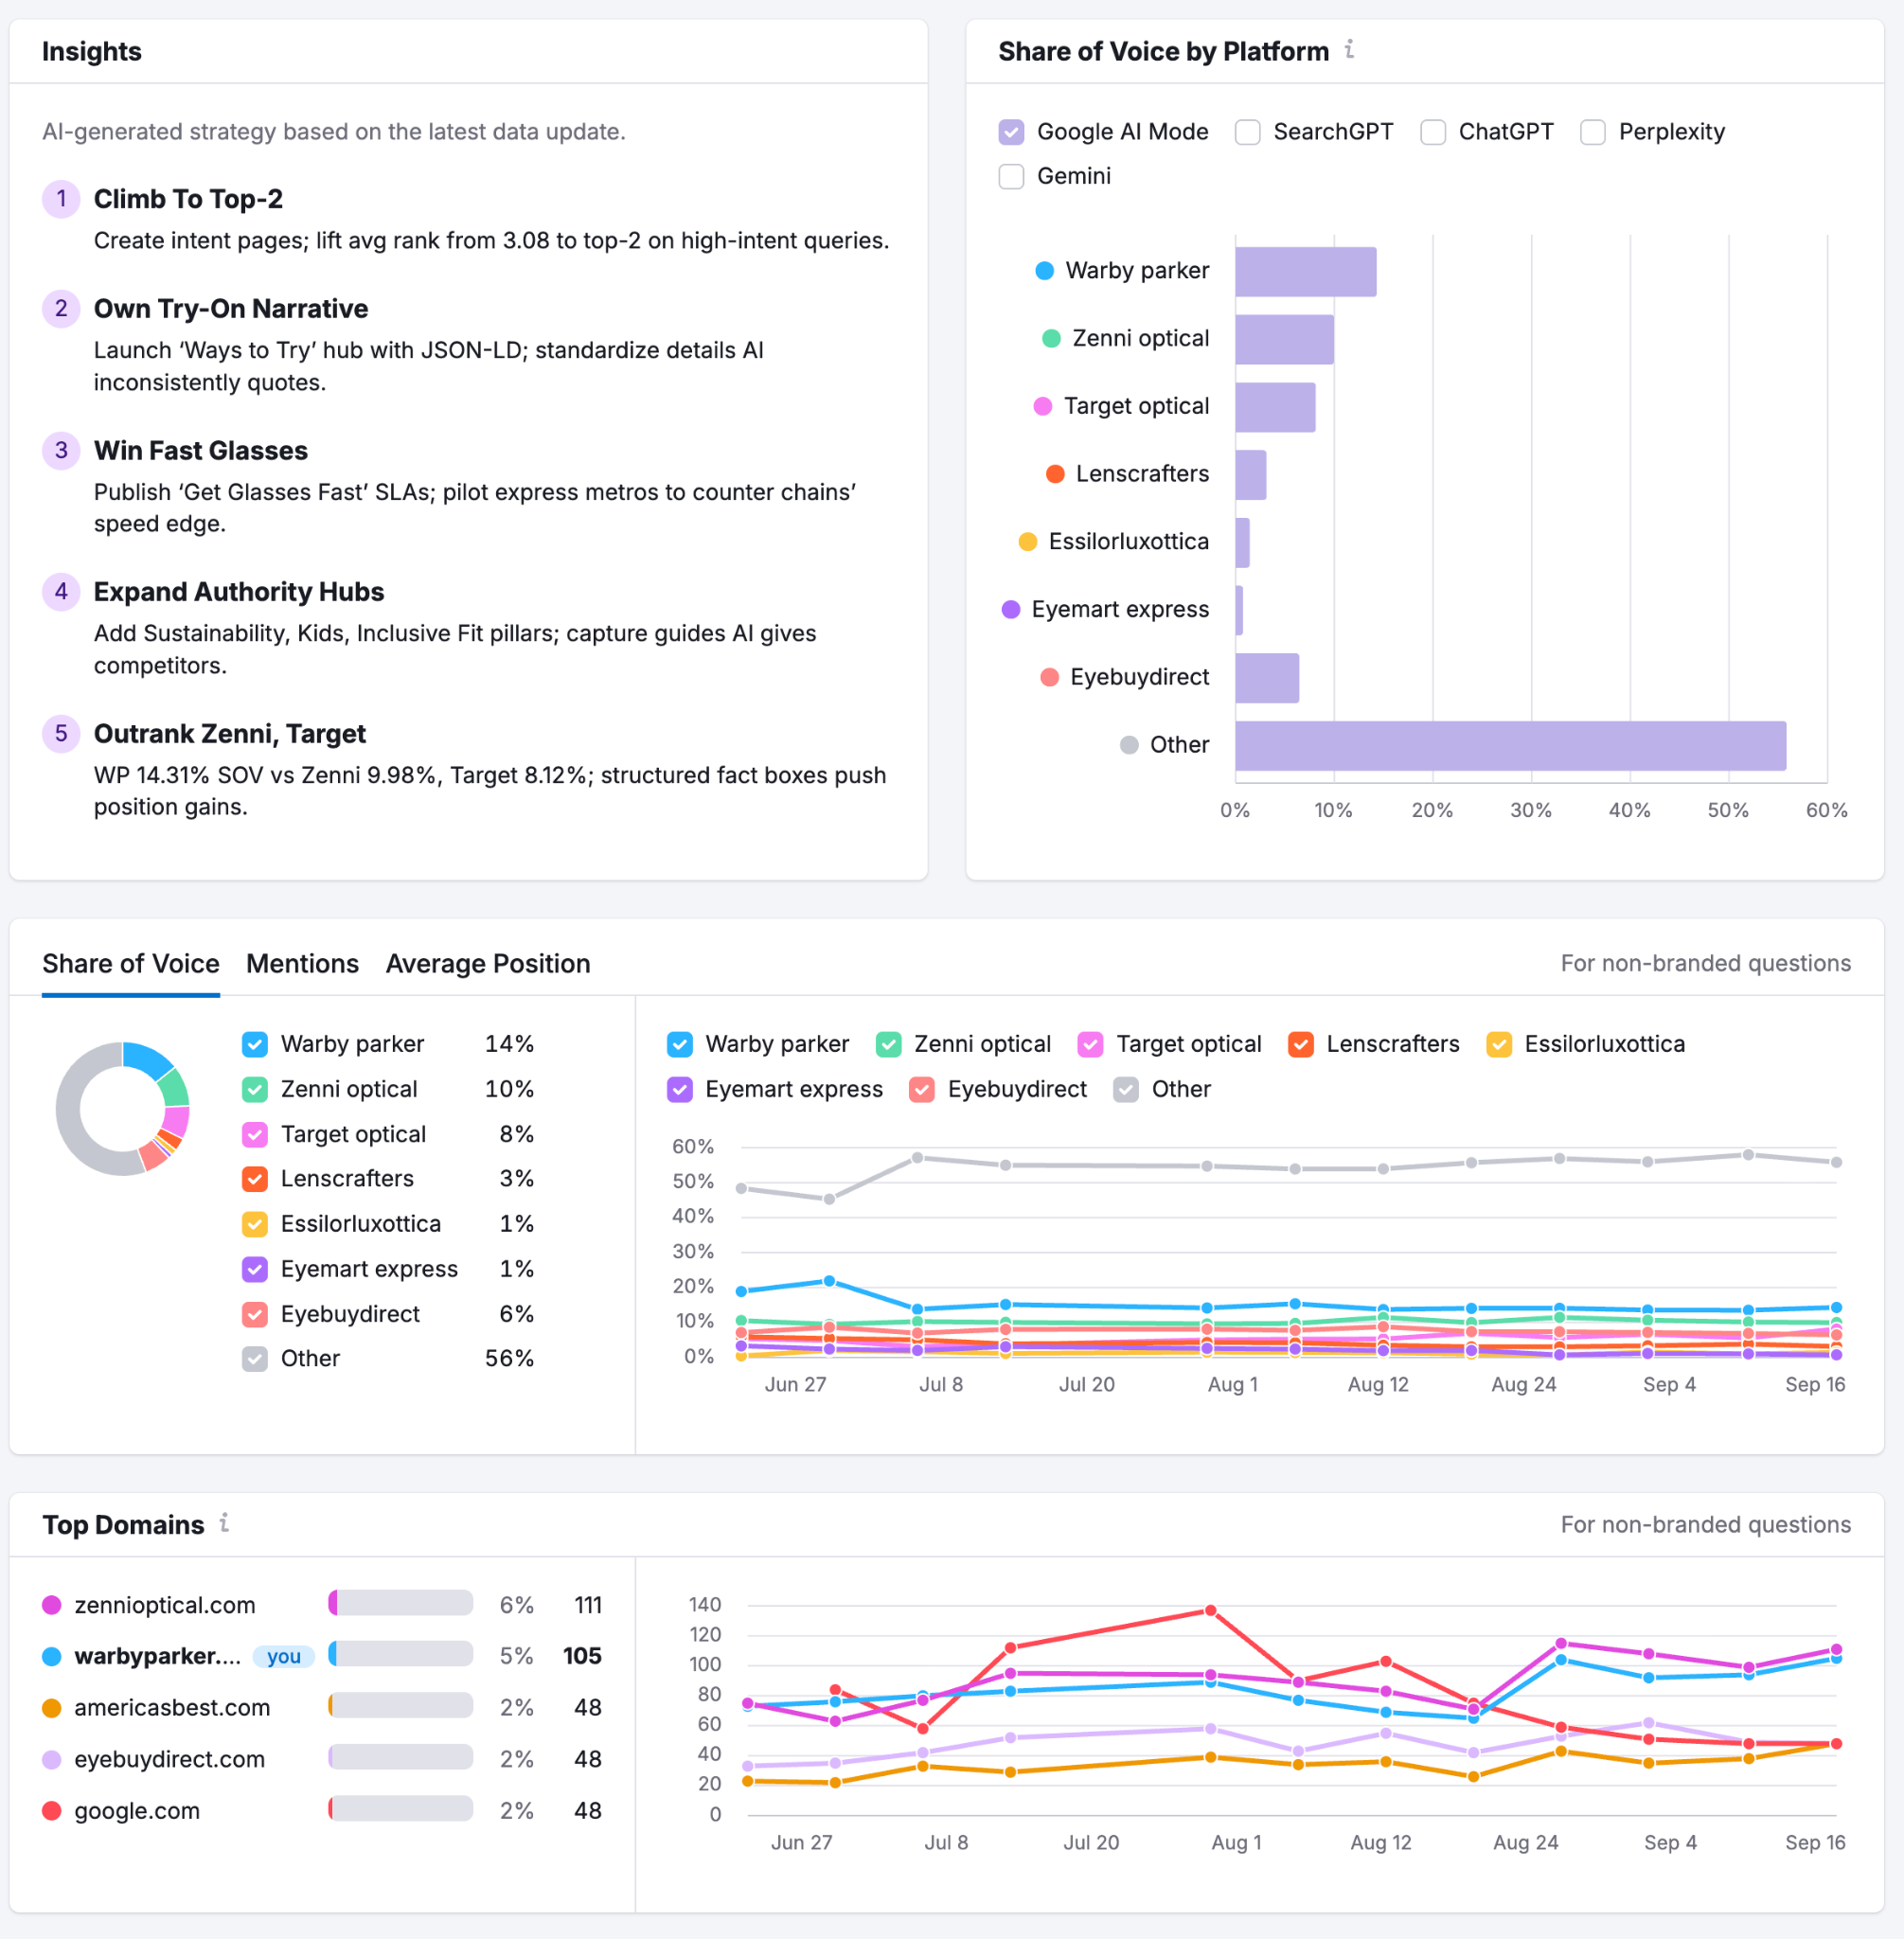
- Share of Voice by Platform: Compares your brand's visibility against competitors across multiple AI platforms. It helps you quickly identify which platforms are your strongest or weakest channels compared to the competition.
- Share of Voice, Mentions, and Average Position: This is a tabbed widget that tracks key metrics over time, allowing you to spot competitive shifts and trends.
- The Share of Voice tab visualizes your overall market share of mentions with a donut chart and tracks the trend with a line graph.
- You can select the Mentions and Average Position tabs to toggle the graph and monitor trends for the total number of mentions or your average rank in AI-generated answers.
- Top Cited Domains: Lists the most influential domains that AI platforms cite for non-branded questions in your topic area. It displays each domain's citation percentage and tracks its performance over time, making it easy to identify key third-party publishers for outreach and partnership opportunities.
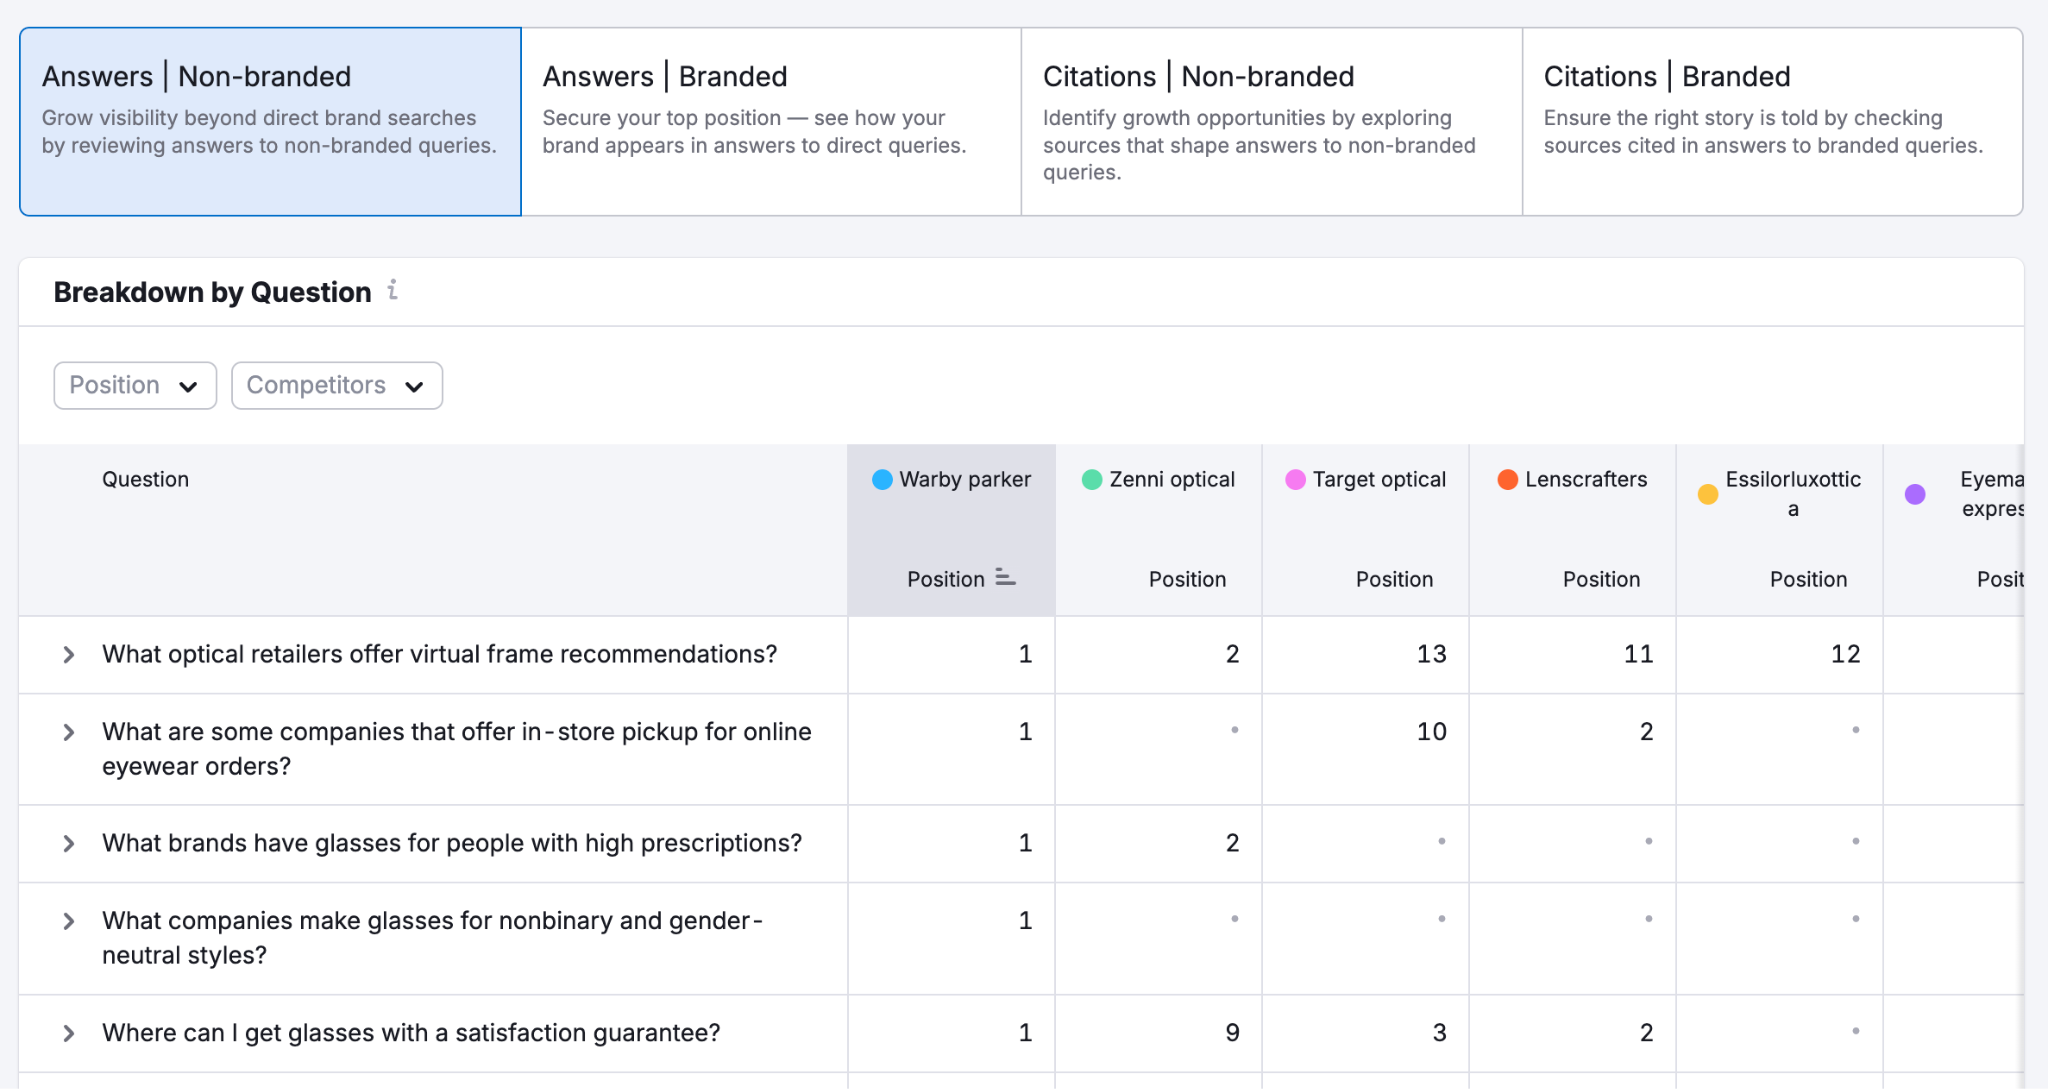
- Breakdown by Question: See how your brand ranks against competitors for specific, high-interest AI prompts. Above the table, use the preset cards to quickly filter the data and find specific insights:
- Answers Non-branded: Grow visibility beyond direct brand searches by reviewing answers to non-branded queries.
- Answers Branded: Secure your top position by seeing how your brand appears in answers to direct, branded queries.
- Citations Non-branded: Identify growth opportunities by exploring the sources that shape answers to non-branded queries.
- Citations Branded: Ensure the right story is being told by checking the sources cited in answers to branded queries.
Step 4: Understand Audience Intent and Queries
The Questions Report helps you gain insight into your audience's intent by analyzing the questions they ask AI.
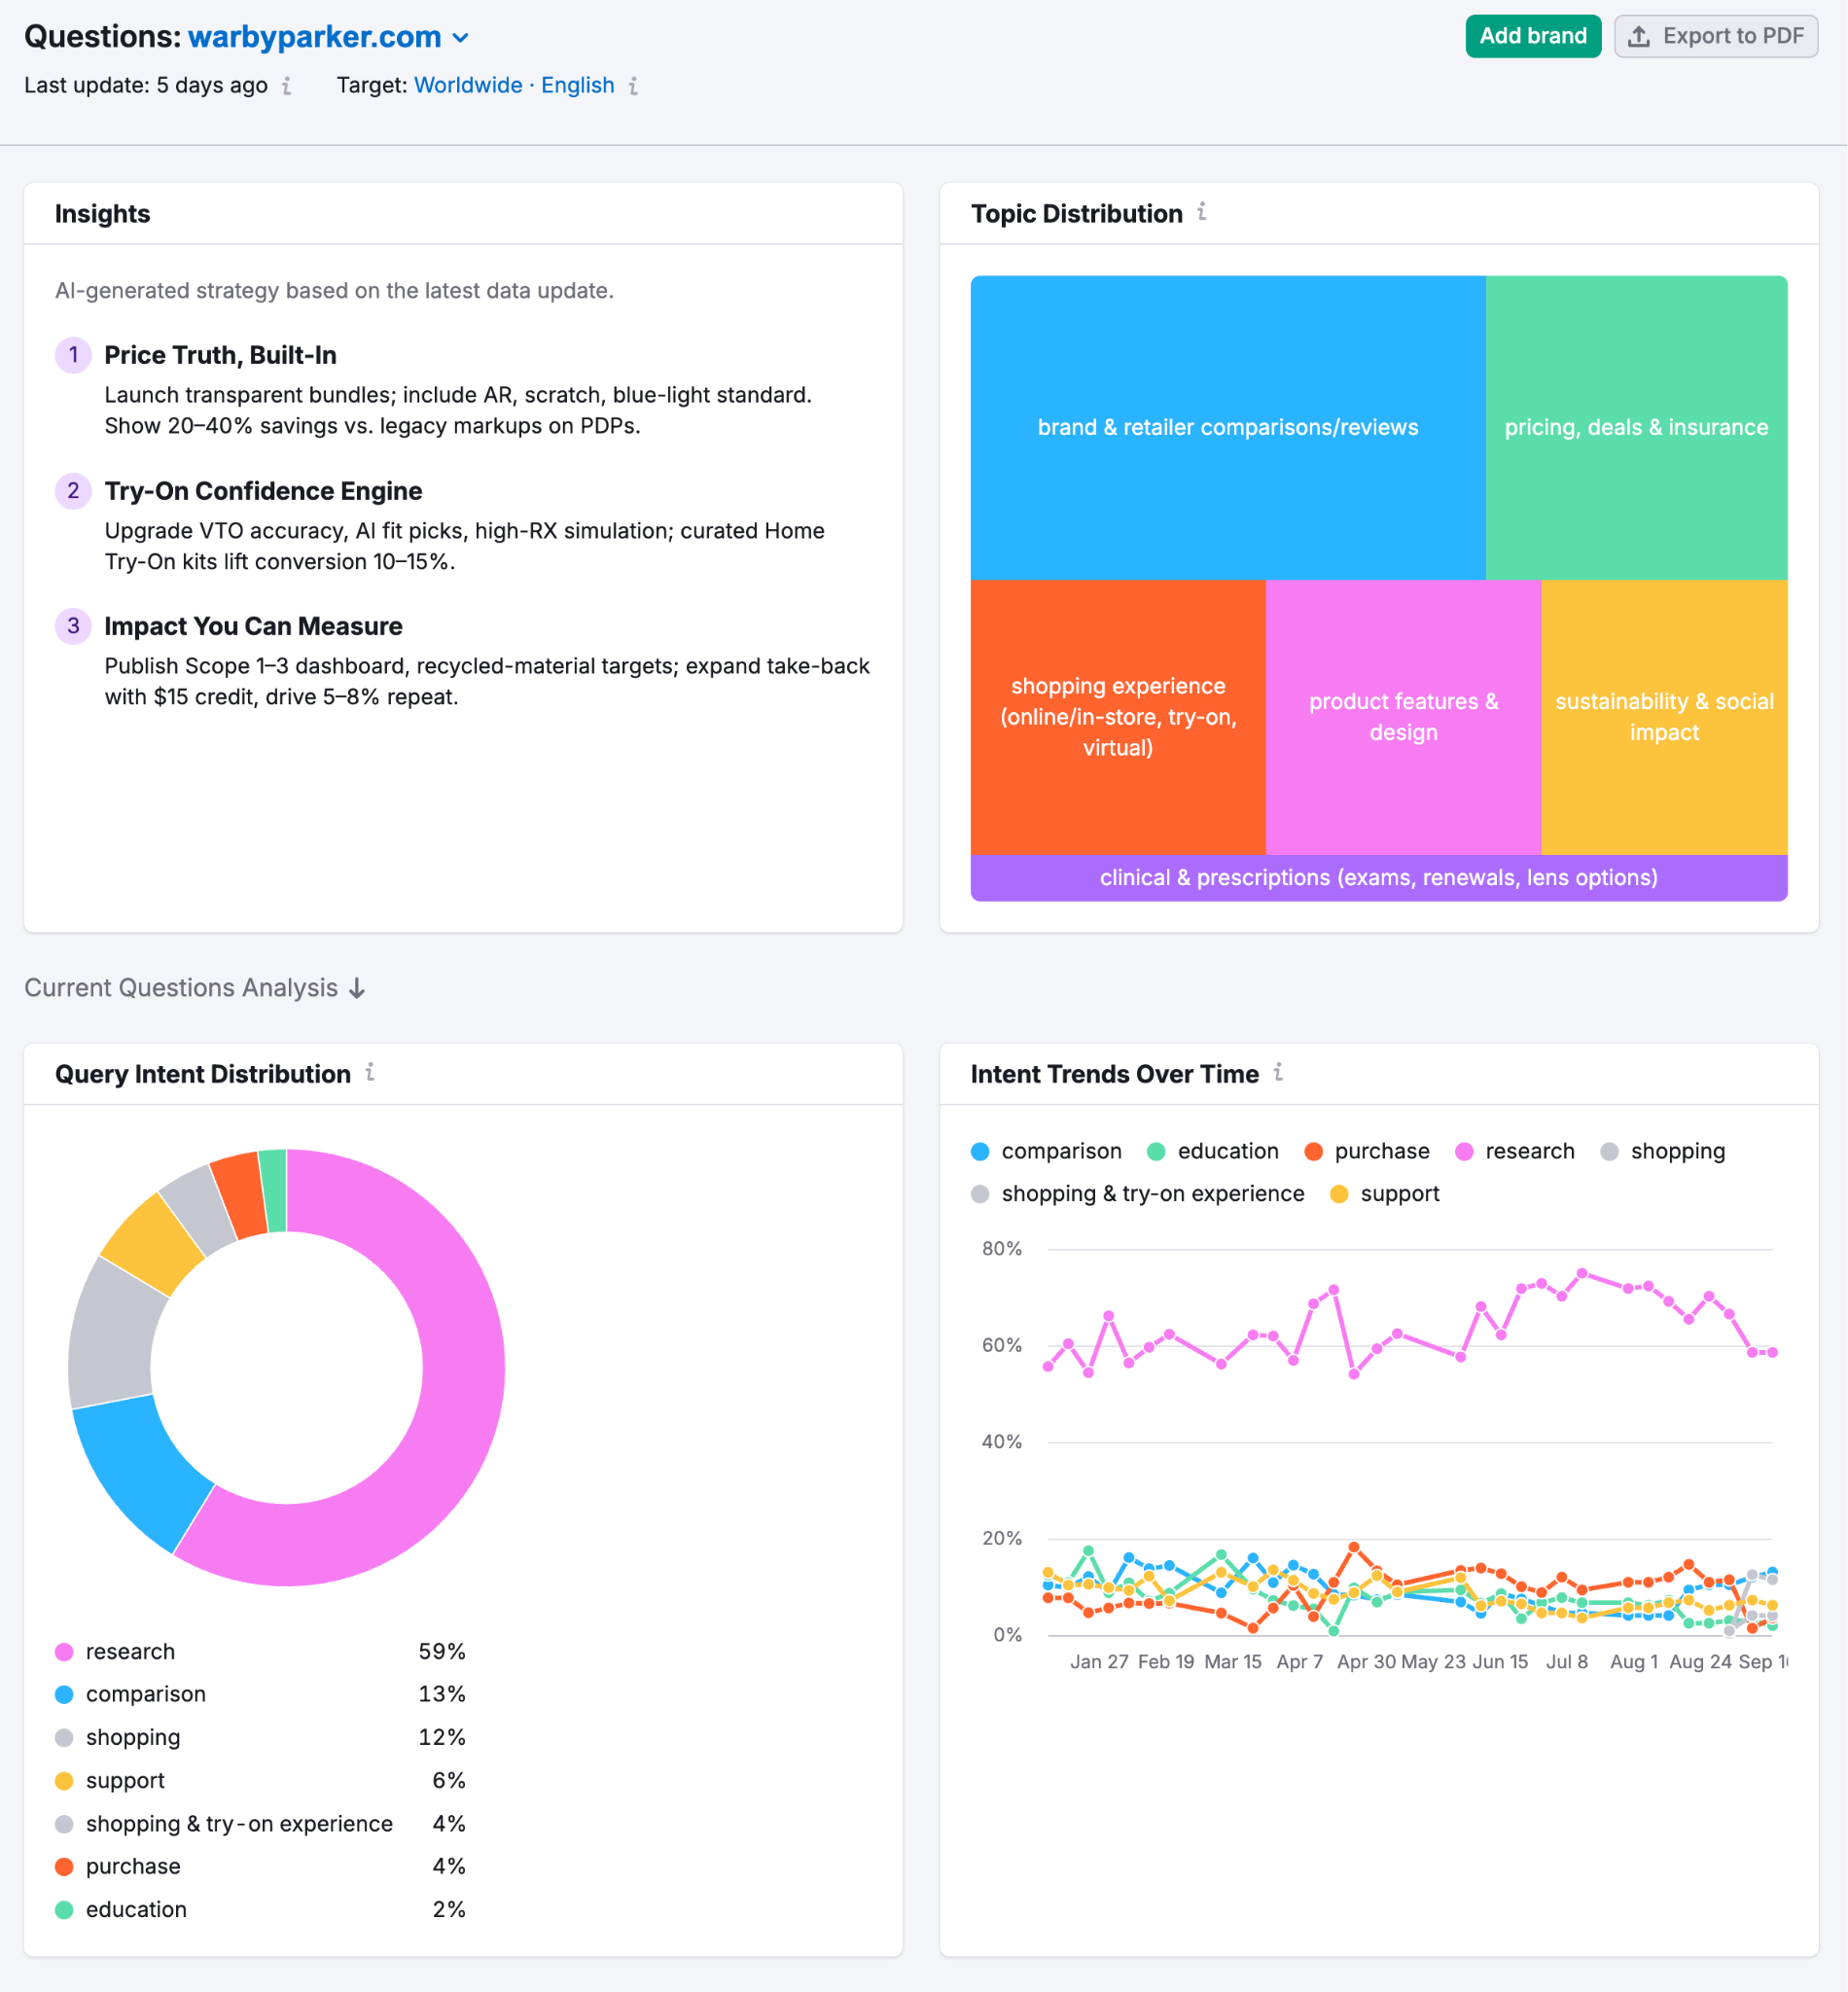
You can explore:
- Topic Distribution: See which themes dominate user queries to understand where to focus your content strategy.
- Query Intent Distribution: Align your content with user needs by seeing whether they are looking to make a purchase, conduct research, or find support.
- The Intent Trends over time graph tracks how these intents shift over time, helping you spot seasonal patterns or sudden changes in audience behavior.
- Topic Analysis & Patterns: Group actual user questions by theme and show the intent mix for each, which is useful for content planning.
Report Coverage
- Data coverage: AI Mode, Chat GPT, Perplexity, Gemini, and SearchGPT
- Update frequency: Weekly
- Locations: 68.5K locations
- Languages: 53