AI PR Toolkit helps you track how your emails are performing with real-time statistics for both individual campaigns and overall outreach. Here’s how to find and interpret the results.
Where to find campaign statistics
To see your email performance:
- Go to Your Emails from the left-hand menu.
- Make sure you're on the All Emails tab.
- Find the email you want to analyze.
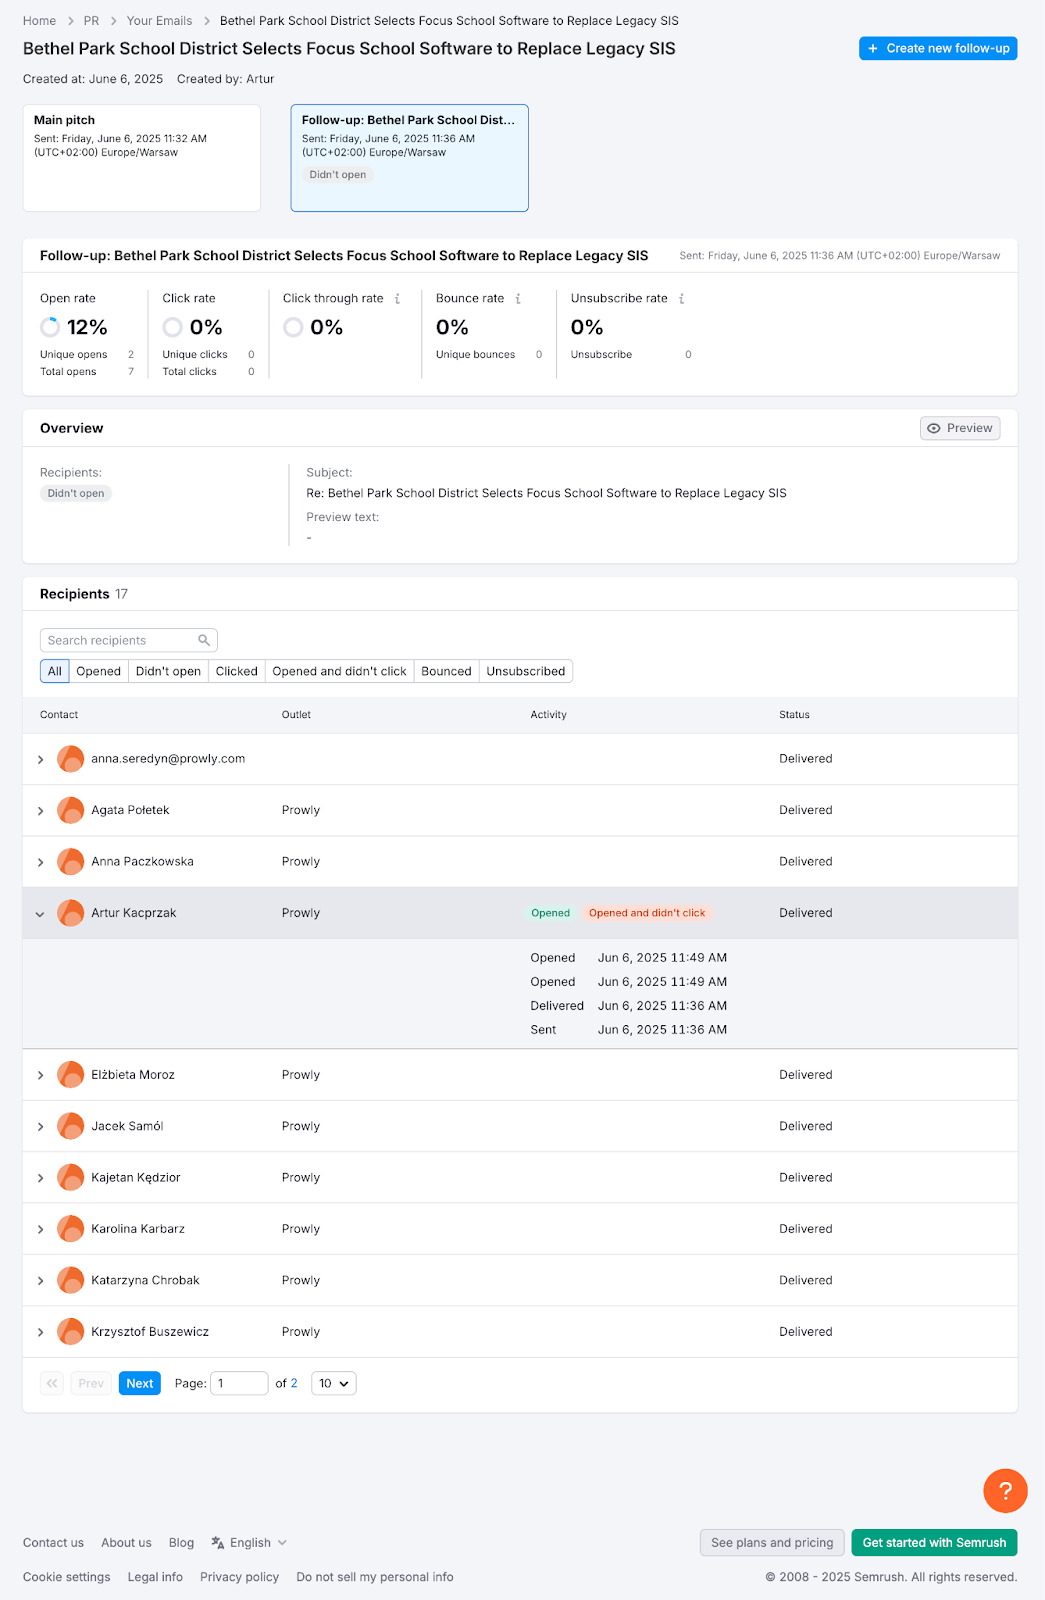
- Click the email title to open detailed stats for that campaign.
You’ll see both an overall summary (all opens, clicks, bounces) and detailed insights per recipient.
Key metrics explained
Open Rate
What it is: The percentage of recipients who have opened the email at least once out of all the recipients who got your message.
How it’s calculated: Open rate = Unique opens / Delivered emails
What affects it:
- Subject line quality – A good subject line sparks curiosity, clearly communicates the message, and matches the recipient's interests. Avoid overly salesy language.
- Timing of delivery.
- Sender name and reputation.
Improve it by:
- Using AI suggestions when you're unsure how to phrase your subject line.
- Sending at optimal times.
- Using clear sender names (e.g., your name and company).
Adjusted Open Rate
What it is: The percentage of verified human opens, filtered to exclude bot activity or auto-opens triggered by privacy tools (like Apple Mail Privacy Protection).
How it’s calculated: Adjusted Open Rate = Verified human opens / Delivered emails
Average Number of Opens
What it is: The average number of times each recipient opened your email. If the number is above 1, it means people returned to your message more than once, which is often a sign of interest or useful content.
Most and least engaged recipients
What it is: Highlights the recipients who interacted the most with your campaign and those who engaged the least.
Why it matters: Helps you prioritize follow-ups with your most responsive contacts and spot disengaged ones who might need a different approach.
Click Rate
What it is: The percentage of recipients who clicked on at least one link or interactive element (like a button or image) in your email out of all recipients who got your message.
How it’s calculated: Click Rate = Unique clicks / Delivered emails
What affects it:
- The placement of links – Add key links early in the message or close to the main CTA.
- Clear call-to-actions
- Matching with the recipient’s interests – Make sure your message links to content they care about (e.g., their beats, recent work, or topics they’ve covered).
Improve it by:
- Keeping links visible and easy to click
- Writing short, benefit-focused CTAs
- Linking to relevant media, like press releases or assets
Click-Through Rate
What it is: The percentage of recipients who clicked on at least one link after opening your email. While Click Rate measures clicks out of all delivered emails, Click-Through Rate focuses only on those who opened the message, helping you see how engaging your content is once someone starts reading.
How it’s calculated: Click-Through Rate = Unique clicks / Unique opens
What affects it:
- Clarity of the message – Is your message easy to understand and focused on one clear goal?
- CTA visibility – Is the call to action placed where it’s easy to see and recognize (e.g., not buried in a long paragraph)?
- Link value to the recipient – Are you linking to something useful or relevant to what the recipient covers?
Improve it by:
- Making your key message clear and engaging
- Placing your CTA so it stands out, e.g., in a separate line or near a bold sentence
- Trying different formats or link placements
Bounce Rate
What it is: The percentage of emails that couldn’t be delivered to recipients due to temporary or permanent issues.
How it’s calculated: Bounce Rate = Bounced emails / All sent emails
What affects it:
- Invalid or incorrect email addresses
- Full inboxes
- Temporary server issues
Improve it by:
- Double-checking email addresses before sending
- Cleaning your lists regularly
- Avoiding generic addresses like info@ or press@, which are more likely to bounce
Unsubscribe Rate
What it is: The percentage of recipients who clicked the unsubscribe link in your email.
How it’s calculated: Unsubscribe Rate = Unsubscribes / Delivered emails
What affects it:
- How often you email the same contacts
- Content that doesn’t match the recipient’s interests or expectations
- Tone or formatting that feels off-putting or too promotional
Improve it by:
- Targeting smaller, relevant groups
- Reviewing subject lines and tone
- Letting users set preferences for frequency or topics
Advanced analytics (Pro plan)
If you’re on a Pro plan, you’ll see additional insights in your campaign statistics. These go beyond basic open and click tracking to show how deeply recipients interact with your emails and whether your outreach led to real PR results.
Read rates
What it is: Shows how much time recipients spent viewing your email, divided into three ranges.
How it’s calculated: Recipients are grouped into segments:
- Read – at least 15 seconds
- Skimmed – 3 to 15 seconds
- Glanced – less than 3 seconds
Why it matters: A high percentage of “Read” indicates your content held attention. More “Glanced” suggests the subject or content may not have been relevant.
Top 5 and low 5 emails
What it is: A ranking of your best- and worst-performing emails across campaigns.
Why it matters: Comparing top and low performers helps you identify patterns in subject lines, content, or timing that impact engagement.
Earned Mentions in Email view
What it is: In Pro plans, earned mentions are visible directly in the email view. You can check whether your pitch led to media coverage.
Why it matters: This saves time and keeps all your key campaign results in one place.
Interpreting the results
Email analytics show not only if someone opened or clicked, but also how many times. This helps you:
- Understand who’s most engaged.
- Prioritize follow-ups.
- Spot patterns over time.
Tip: Each metric is explained in the app; just hover over the one you’re unsure of.
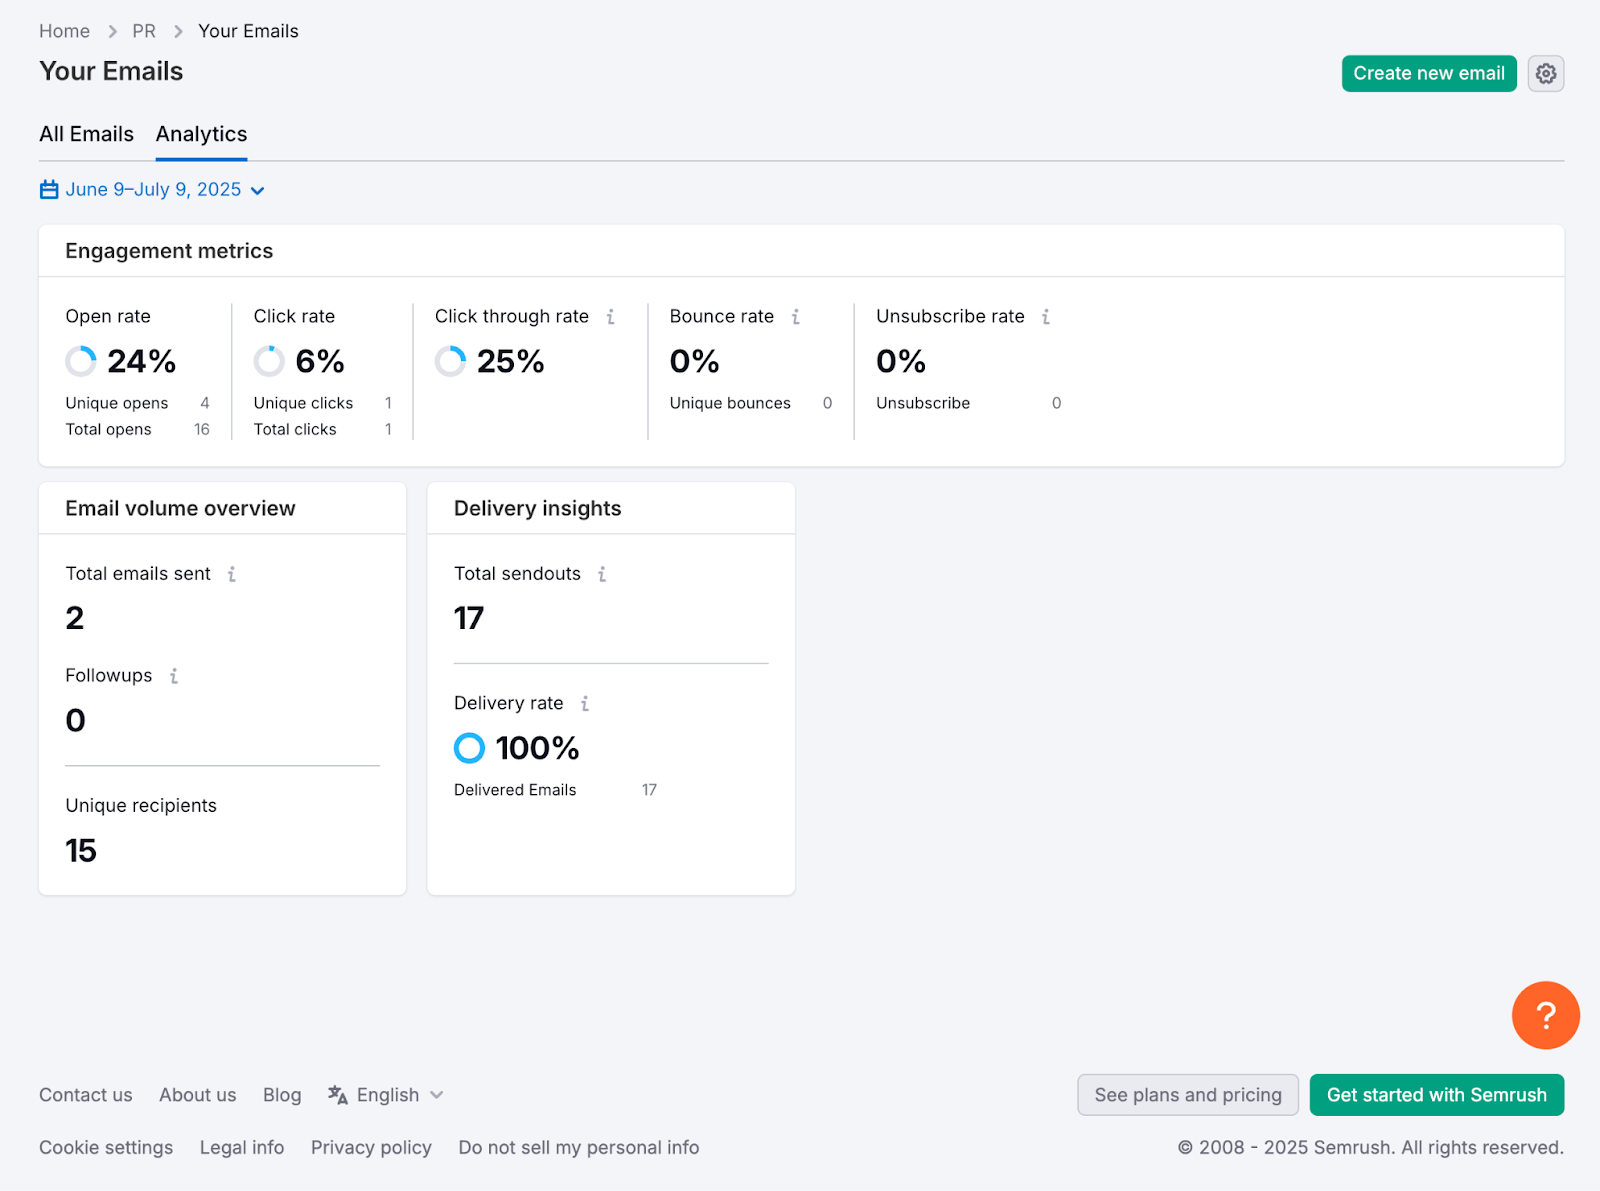
Global email performance
To see aggregated statistics across your campaigns:
- Go to Your Emails.
- Click the Analytics tab.
You’ll find:
- Engagement metrics – Aggregated opens, clicks, bounces, CTRs, and unsubscribes.
- Email volume – Number of emails and follow-ups you’ve sent.
- Delivery insights – Overall delivery rate and total send-outs.
Use the date picker to adjust the timeframe.